Formula 1 Fantasy League Spreadsheet
- Daniel Taylor

- Aug 27, 2023
- 11 min read
I am a massive Formula 1 fan. I have been following the series properly since 2017 and since the 2020 season, I have never missed a race. I watch all sessions of F1, including practice sessions: content that is not that commonly watched. Since the 2021 season, my friends and I wanted to get involved in the F1 Fantasy game and made a wager that the loser of the League would need to buy a meal for the winner. At this point I was already making spreadsheets regarding F1 and the F1 Fantasy was an opportunity to expand my data-driven decision-making into the game.
I started making these F1 spreadsheets because I was interested in seeing a statistical representation of how strong or weak a driver and team is across the season. I find the championship standings do not fully represent how strong someone has been during the year, especially for drivers near the back of the grid who have suffered from being unlucky and thus do not score points. I also wanted to see their recent form in the most recent races and visualise them. That was why I started making this document.
This post will go through in-depth the spreadsheet I use for the F1 Fantasy League, which serves as the basis for other spreadsheets for other motorsport series I have an interest in, namely Formula 2, Formula 3, F1 Academy, Formula E, INDYCAR and INDY NXT, and the FIA World Endurance Championship.
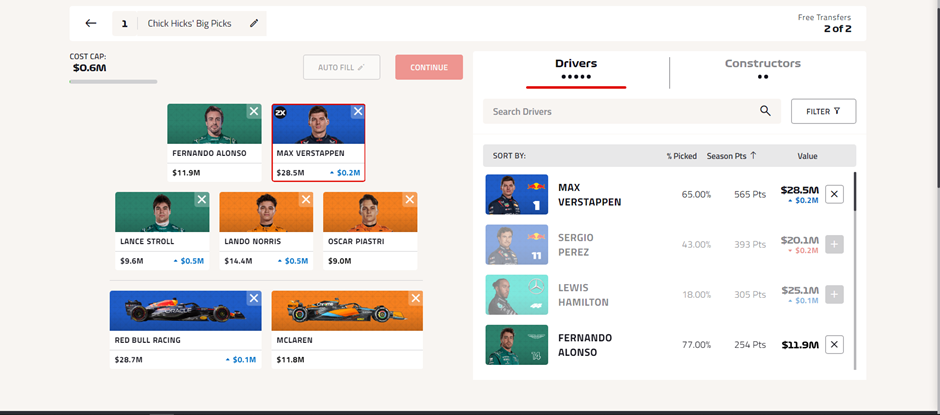
The way the F1 Fantasy League works is every player has a starting budget, with all drivers and teams having different prices. The player would need to select five drivers and two teams that are within their budget, and throughout the race weekend, these drivers and teams will score points based on their performance. Different actions provide points, such as qualifying in the top 10, overtaking drivers and finishing the race in the top 10, whilst losing positions during the race or receiving a DNF (Did Not Finish) during the race and a non-classification means a deduction of points.
Methodology:
Below is an overview of the different bits of data that I use to come up with my rankings and decision-making for F1 Fantasy, which makes up different factors. These factors will be explained in further depth below.
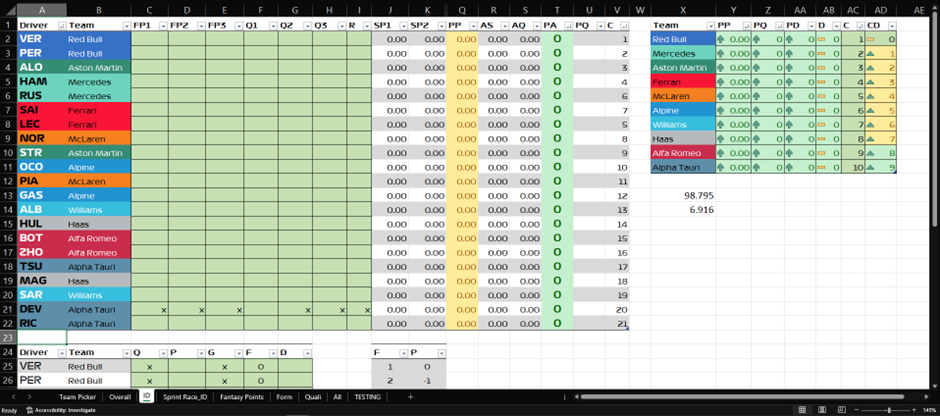
The ID spreadsheet is where I input data from the weekend. A typical F1 weekend has three practice sessions, a qualifying session and a race session. For the race session, I input the drivers’ finishing position. For every other session, I input their gap from 1st position in a 0.000 format. From there I have scales to determine their ‘score’ for each session, giving a value of 1 for people with the best time/finished 1st, and 0 for those in last place. Every driver in-between 1st and 20th would have their points scaled to that maximum. I then find the average score for each session and label that column ‘AS’. I also do the same for the important sessions, specifically qualifying and the race. Afterwards, I multiply these by 100 to get a score out of 100 to add to other spreadsheets.
The columns shown describes as follows:
Driver: The driver’s name
Team: The team the driver is racing with
FP1: Their gap to 1st in Free Practice 1
FP2: Their gap to 1st in Free Practice 2
FP3: Their gap to 1st in Free Practice 3
Q1 through Q3: Their gap to 1st in Qualifying 1, 2 and 3
R: Their finishing position
SP1 through SP2: Their score is between 1 and 0, 1 is best and 0 is worst.
PP: Practice Pace, averaging the score between FP1, FP2 and FP3.
AS: The average score across all sessions
AQ: The average score across qualifying and the race
PA: The total points they accrued out of 100 in every session
PQ: The total points they accrued out of 100 in competitive sessions.
C: Their championship position
The extra table on the right consisting of just the teams is solely to visualise their practice pace and their qualifying and race performance, with indicators of whether teams over or under-performed in a race weekend. Below this first table is a table to explore something I call “form”.
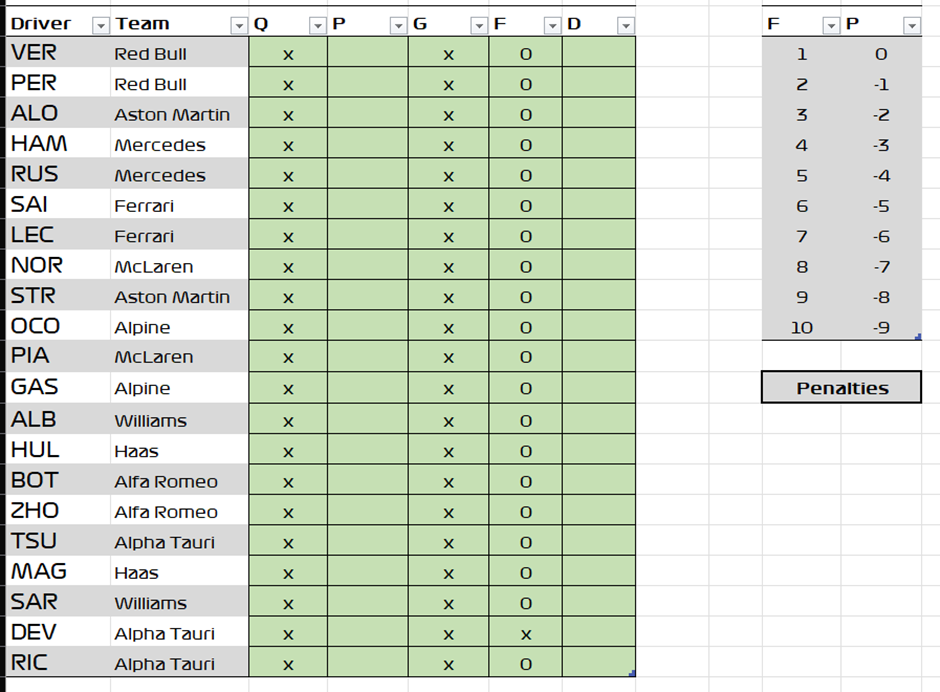
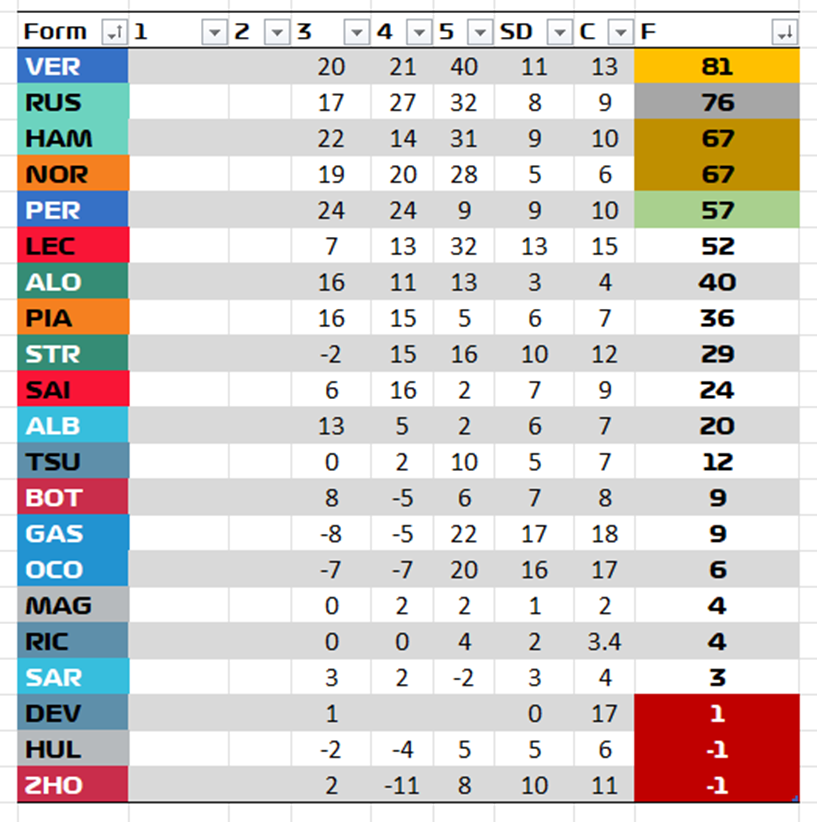
Form is the calculation I use to better present how well someone performed in a race. Typically, drivers who finish in the top ten and thus score points are considered to have a “good race”, but this judgement doesn’t consider whether they gained or lost places to lead to that final position. This is where Form comes in: first, I give points to those who finish in the top ten, scaling from 20 points for 1st place to 11 points for 10th. This is scaled to how many drivers took part in the race, so if only 19 drivers compete, 1st would get 19 points and it will scale down to 10th. Drivers who finish outside the top ten get 0 points. Afterwards, I find the difference between their starting position and their finishing position. Form is then calculated by adding these two numbers together. For example, if a driver starts from P20 and finishes P10, they will get 11 points for finishing P10, and 10 points for gaining 10 positions, leading to a total of 21 points.
The columns shown describes as follows:
Driver: The driver’s name
Team: The team the driver is racing with
Q: Their qualifying position
P: Any grid penalties the driver had which is applied after qualifying
G: Their starting position on the grid on raceday
F: Their finishing position
D: Their form: I also called this “delta”.
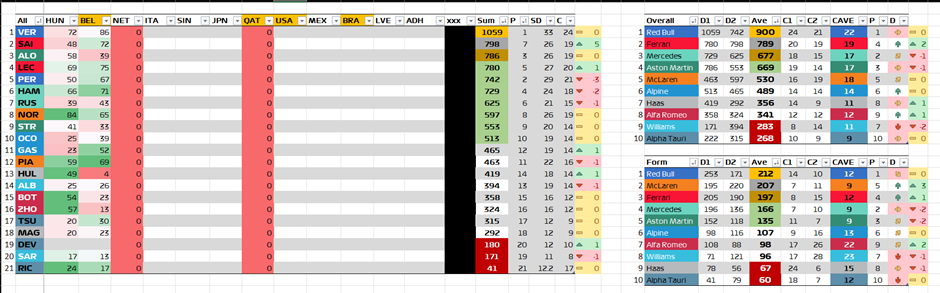
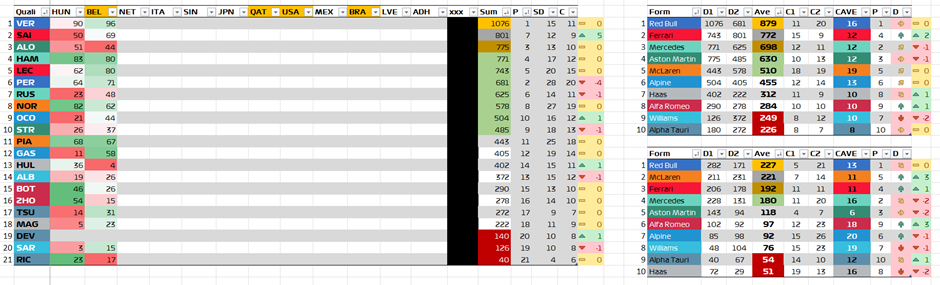
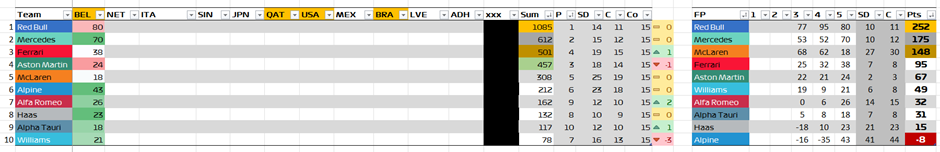
The next image shows the ‘ALL’ spreadsheet where I collect the total score each driver got from the PA column from the ‘ID’ spreadsheet. For visualisation, I’ve applied a gradient for each driver where green is their highest score ever gotten, and red is the lowest score ever gotten. Columns BEL, QAT, USA and BRA are highlighted yellow to indicate the new Sprint weekend format F1 is trialling this year. They use a different ID spreadsheet that will not be covered in this post. The main difference of this is instead of three practice sessions, there is only one session. There is also a sprint qualifying session and a sprint race, where the top eight score points. The logic from the standard ID spreadsheet applies here, including calculating their form. The ‘xxx’ column was just a placeholder since F1 cancelled one race weekend, so I shifted all subsequent races across one column. This placeholder was put here to avoid formulas breaking across the file.
Other column titles mean this:
Sum: pretty self-explanatory: it is the sum of each driver’s score.
P: championship position
SD: standard deviation of all scores a driver obtained.
C: the confidence interval of the data, considering a 99% confidence level. For example, For “VER” his 99% confidence level for his average score per race weekend is 76 ± 24, thus between 52 and 100.
The next column just shows whether they are ranked above, below or equal to their championship position, and by what value. For example, “SAI” is ranked 2nd in this table, but 7th in the championship standings, showing a difference of 5 positions.
The top right table shows the team performance across the whole season by finding the average of both cars and drivers during the season. I also find the average of their confidence interval, which helps me identify consistency: a smaller confidence interval shows teams are performing at a regular level across the season. The “P” column is their team’s championship position, and “D” is meant to show how close the drivers are performing compared to each other. A green upward arrow means both drivers are close together in their performances, and a red downwards arrow means one driver is strongly outperforming their teammate.
The table directly below that is structured the same way, but this time considers their drivers and teams’ last 3 races, looking into their more recent performances. This is one of the datasets used in my main F1 Fantasy spreadsheet, as it better represents a team’s uptick in form.
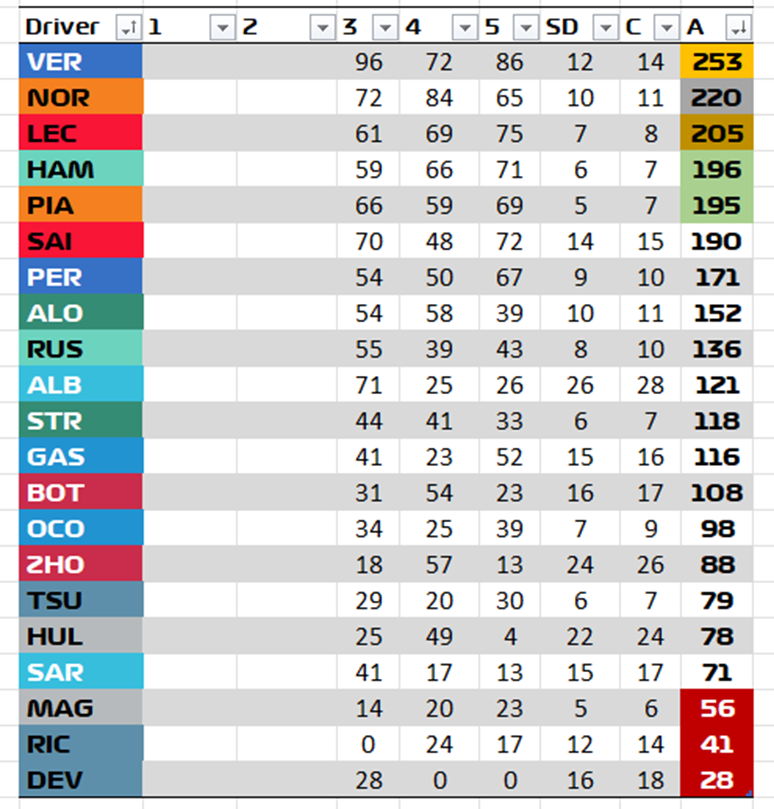
The above table shares the same information of the last three races, this time per driver. The columns list 1 through 5, as originally this spreadsheet used the last five races. However, after the recent improvement by McLaren from the Austrian and British Grands Prix, I decided to change from considering the last five races to the last three races. McLaren’s upform and how competitive this season has been – bar Red Bull – led me to be more recent with the data.
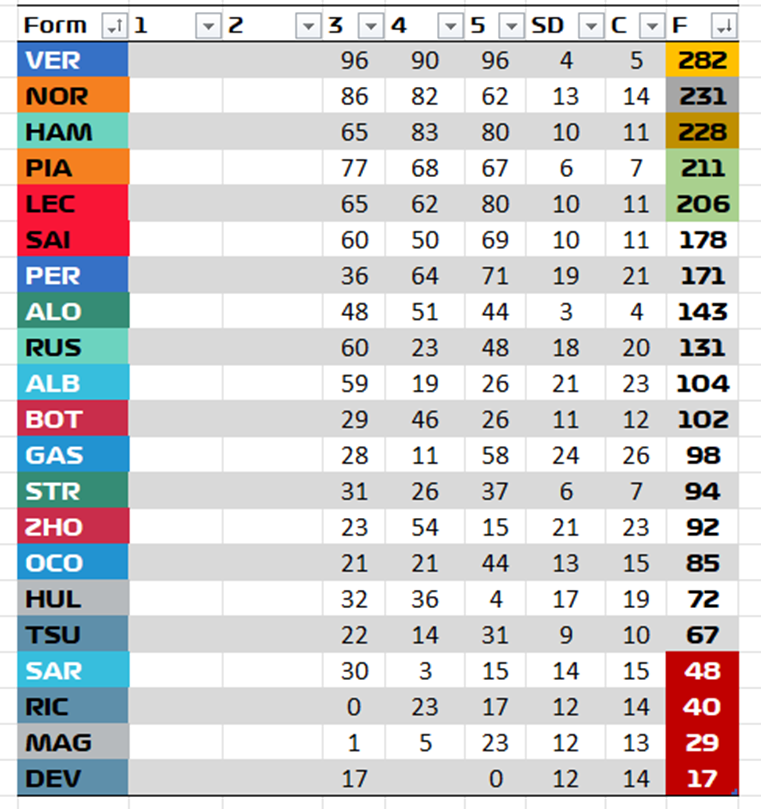
The structure of the ‘ALL’ spreadsheet is repeated for two other sheets, the ‘QUALI’ and ‘FORM’ spreadsheet. Screenshots of both are shown below.
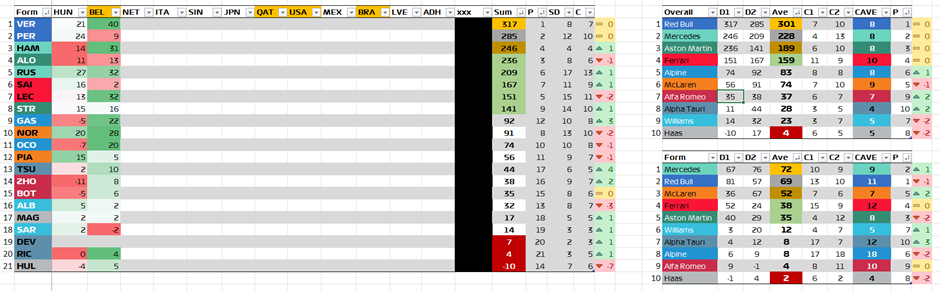
The next screenshot is where I document the F1 Fantasy points the website gives each driver and team. Once again, the structure of the sheet is similar to that of ‘ALL’, ‘QUALI’ and ‘FORM’.
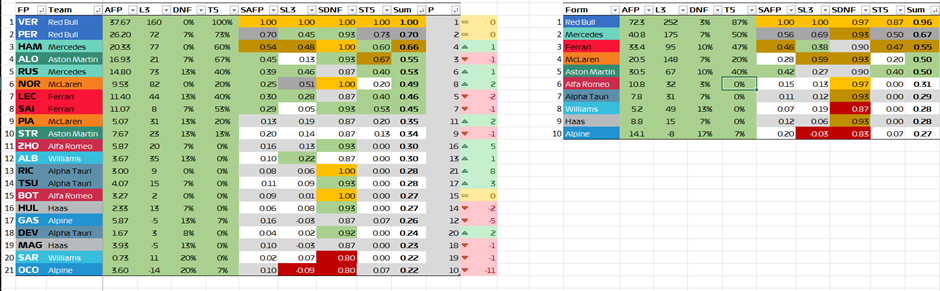
Alongside the main tables documenting the drivers and teams’ overall performance in terms of F1 Fantasy points and within the last three races, I made my own table to help deduce which driver and team are good picks for F1 Fantasy. Both tables have the same column organisation, and this is what each column means:
FP: Just a title placeholder, here are the driver names.
Team: The team the driver is racing for.
AFP: Average Fantasy points, this calculates how many Fantasy points each driver earns on average.
L3: Fantasy points in the last three races. Once again to help visualise driver and team form.
DNF: The percentage of races where the driver did not finish. In F1 Fantasy, a DNF results in -20 points, so it is important to know who’s more likely to finish races. As of the Belgian Grand Prix, only four drivers have a 100% finishing record (Verstappen, Hamilton, Norris, Ricciardo).
T5: The percentage of races where the driver finished in the top five. Verstappen is the only driver so far to have finished every race in the top five, which makes him a must-have in F1 Fantasy.
The next four columns are the score columns, where the best AFP, L3, DNF and T5 values get the highest score of 1, and other results are scaled off that maximum.
Sum: The average of these four score columns (Yes, I am very aware the title is wrong :D).

And here comes one of the main spreadsheets for how I play F1 Fantasy: the ‘OVERALL’ sheet. This sheet is one of two that help me pick a team for F1 Fantasy, using all the previously mentioned metrics. Looking at the left table with all the driver names, here is what each column means.
Driver/Team: Self explanatory
CP: Championship position
Pr: Their price on the F1 Fantasy website
Po: Their F1 Fantasy points in the last three Grands Prix
VPo: The “value” of the driver, essentially how many points can I get per price (Po/Pr)
F3R through A3R: The driver’s form score, qualifying score, and all score in the last three races.
C3R: The sum of the driver’s form confidence interval and qualifying confidence interval, again looking at the last three races.
FP: Their fantasy score based on the calculation in the earlier section.
AF: An overall score, considering 4 main factors. I find the average of each factor, then multiply the result by 0.25. Afterwards I add them together to get the overall score. These are the four factors.
The average of FR, QR, AR, CR (their form, qualifying, all score and confidence interval of their form and qualifying, considering all races). This metric is still considered to show the overall strength of a driver.
The average of F3R, Q3R, A3R, C3R (same as above but considering the last three races).
The average of PoR, VPoR and FP (the score of their points [1 for the most Fantasy points, the rest scaled down], repeated for the value of their driver, and the Fantasy score based on my earlier calculation).
The AS score from the ID spreadsheet, considering how well they have done so far in the practice sessions of the active race weekend.
AO: A score that isn’t used for F1 Fantasy, meant to showcase how well a driver as done in the season, looking at their performance across every session as well as their championship points.
D: Showing whether they are overperforming or underperforming their championship position, looking at AO.
“.”: just to show N or R: N meaning “Driver part of New team” and R meaning “Rookie driver”.
P: Their points in the F1 World Championship standings with conditional formatting. This will be explained further on.
The table on the right covering the teams share similar columns to the left table of the drivers. Below the team table is some information about the number of rounds left in the season, the number of points left for drivers and the number of points left for constructors. The first “Edit this” cell is for standard race weekends, and the second for sprint weekend formats, as they offer different points. Lastly, there is a cell to denote the race number just completed: i.e. the last round was Round 12 in Belgium. This stat is used for two things. Firstly, it is used for the last three days calculation: as the race number increases, it automatically adjusts the races that are shown in the table above. For example, with Round 12 complete, the tables will take the scores from Round 10, 11 and 12. When F1 completes Round 13, the tables will shift one column to the right to take Round 11, 12 and 13 for its calculations.
Secondly, the points left information is related to the conditional formatting involved in the “P” columns for both drivers and teams. The formatting is as follows:
If the number has a darker green fill and bold text, this means that this driver/team can lead the championship after one round. This would mean drivers are within 26/34 points of the driver in 1st, or teams are within 44/59 points of the team in 1st. In the case of this season only Max Verstappen and Red Bull have this formatting, given their dominance so far.
If the number has a red fill and text, this means that this driver/team is mathematically out of contention for the driver’s or team’s title respectively. This would mean they are more points away from the total points remaining, i.e. Albon has 11 points, he is more than 303 points away from Verstappen and there is only 284 points remaining in the season, thus ruling him out of contention. Another example is Williams/Haas. Both have 11 points and are 492 points away from Red Bull, and there is only 485 points remaining for teams in the season, thus ruling them out of contention.
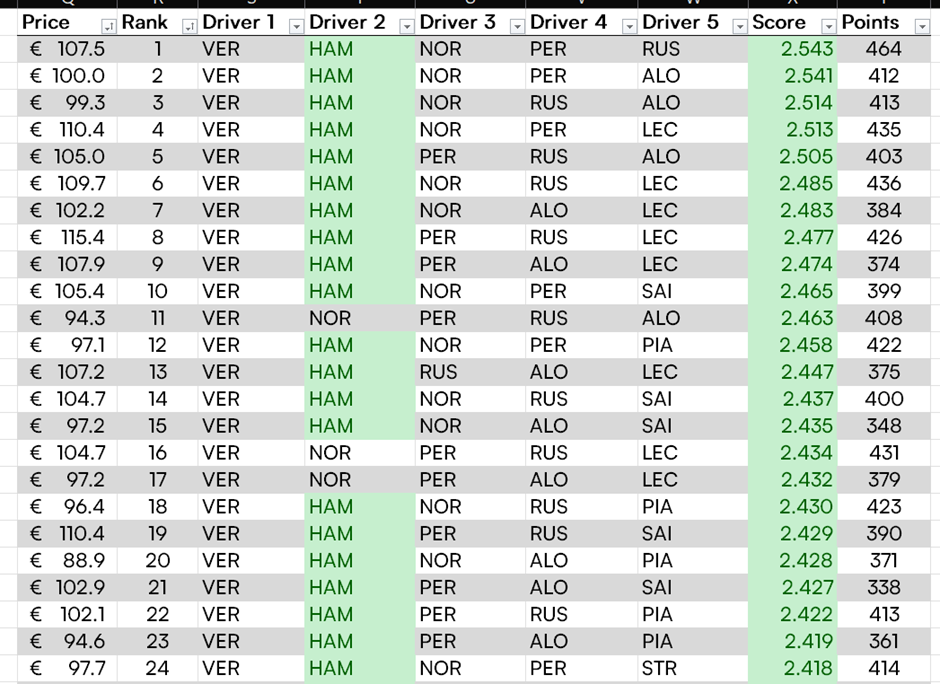
Now we get to proper math! This is the first table in the “Team Picker” spreadsheet, which I use to find the best combination of teams and drivers to give me the best chance of good points. This first table contains every single unique 5-driver combination out of 20, which mathematically adds up to 15,504 possible combinations. Let’s look at what each column means in this table:
Driver 1 through 5: self-explanatory, these list each 5-driver combination possible.
Price: The combined F1 Fantasy price of a 5-driver combination. This will be used in the next part when picking the teams.
Rank: The ranking of the score column
Score: The sum of each driver’s value in the ‘OVERALL’ sheet, column “AF”.
Points: The sum of each driver’s F1 Fantasy points in the last three races. For example, the first column with drivers Verstappen, Hamilton, Norris, Perez and Russell have scored a total of 464 points in the last three races.
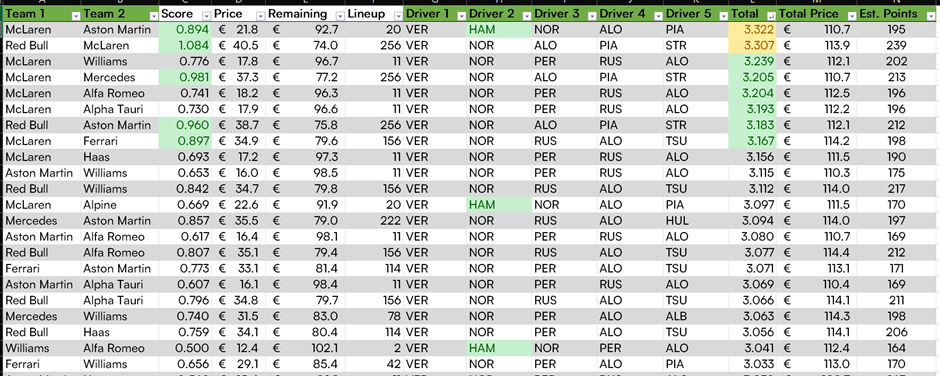
This is the second picture in the “Team Picker” spreadsheet, where I pick the two teams and the best driver combination that gives me the most points and is under my budget. Teams 1 and 2 consist of all possible team pairs out of a choice of ten, which adds to 45 possible combinations. The rest of the columns are as follows:
Score: The sum of each team’s value in the ‘OVERALL’ sheet, column “AF”.
Price: The sum of each team’s F1 Fantasy prices
Remaining: Displays how much money is remaining from the F1 Fantasy budget. At the time of this screenshot, my F1 Fantasy budget was €114.5. If I take the second row with Red Bull and McLaren, their total price is €40.5, leaving a remainder of €74.0 to spend on drivers.
Lineup: This is where the driver lists come into play. This column gives the ranking of the best driver combination that is within the budget.
Driver 1 through 5: The combination of drivers with the aforementioned ranking
Total: The sum of the team’s value in the ‘OVERALL’ sheet, column “AF”, and the sum of that for the drivers.
Total Price: The sum of the five drivers and two teams’ price in F1 Fantasy
Est. Points: This takes the five drivers’ points from the last three races, adds the points from the teams in the last three races, and then divides the result by three, to give an average of points in the last three races, which gives an idea of how strong a team could be solely based on F1 Fantasy points acquisition.
And the top team combination gets picked for the F1 Fantasy, which concludes this post about the spreadsheet. There will definitely be parts that I did not explain well so if you would like to learn more about this, feel free to contact me!


Comments